

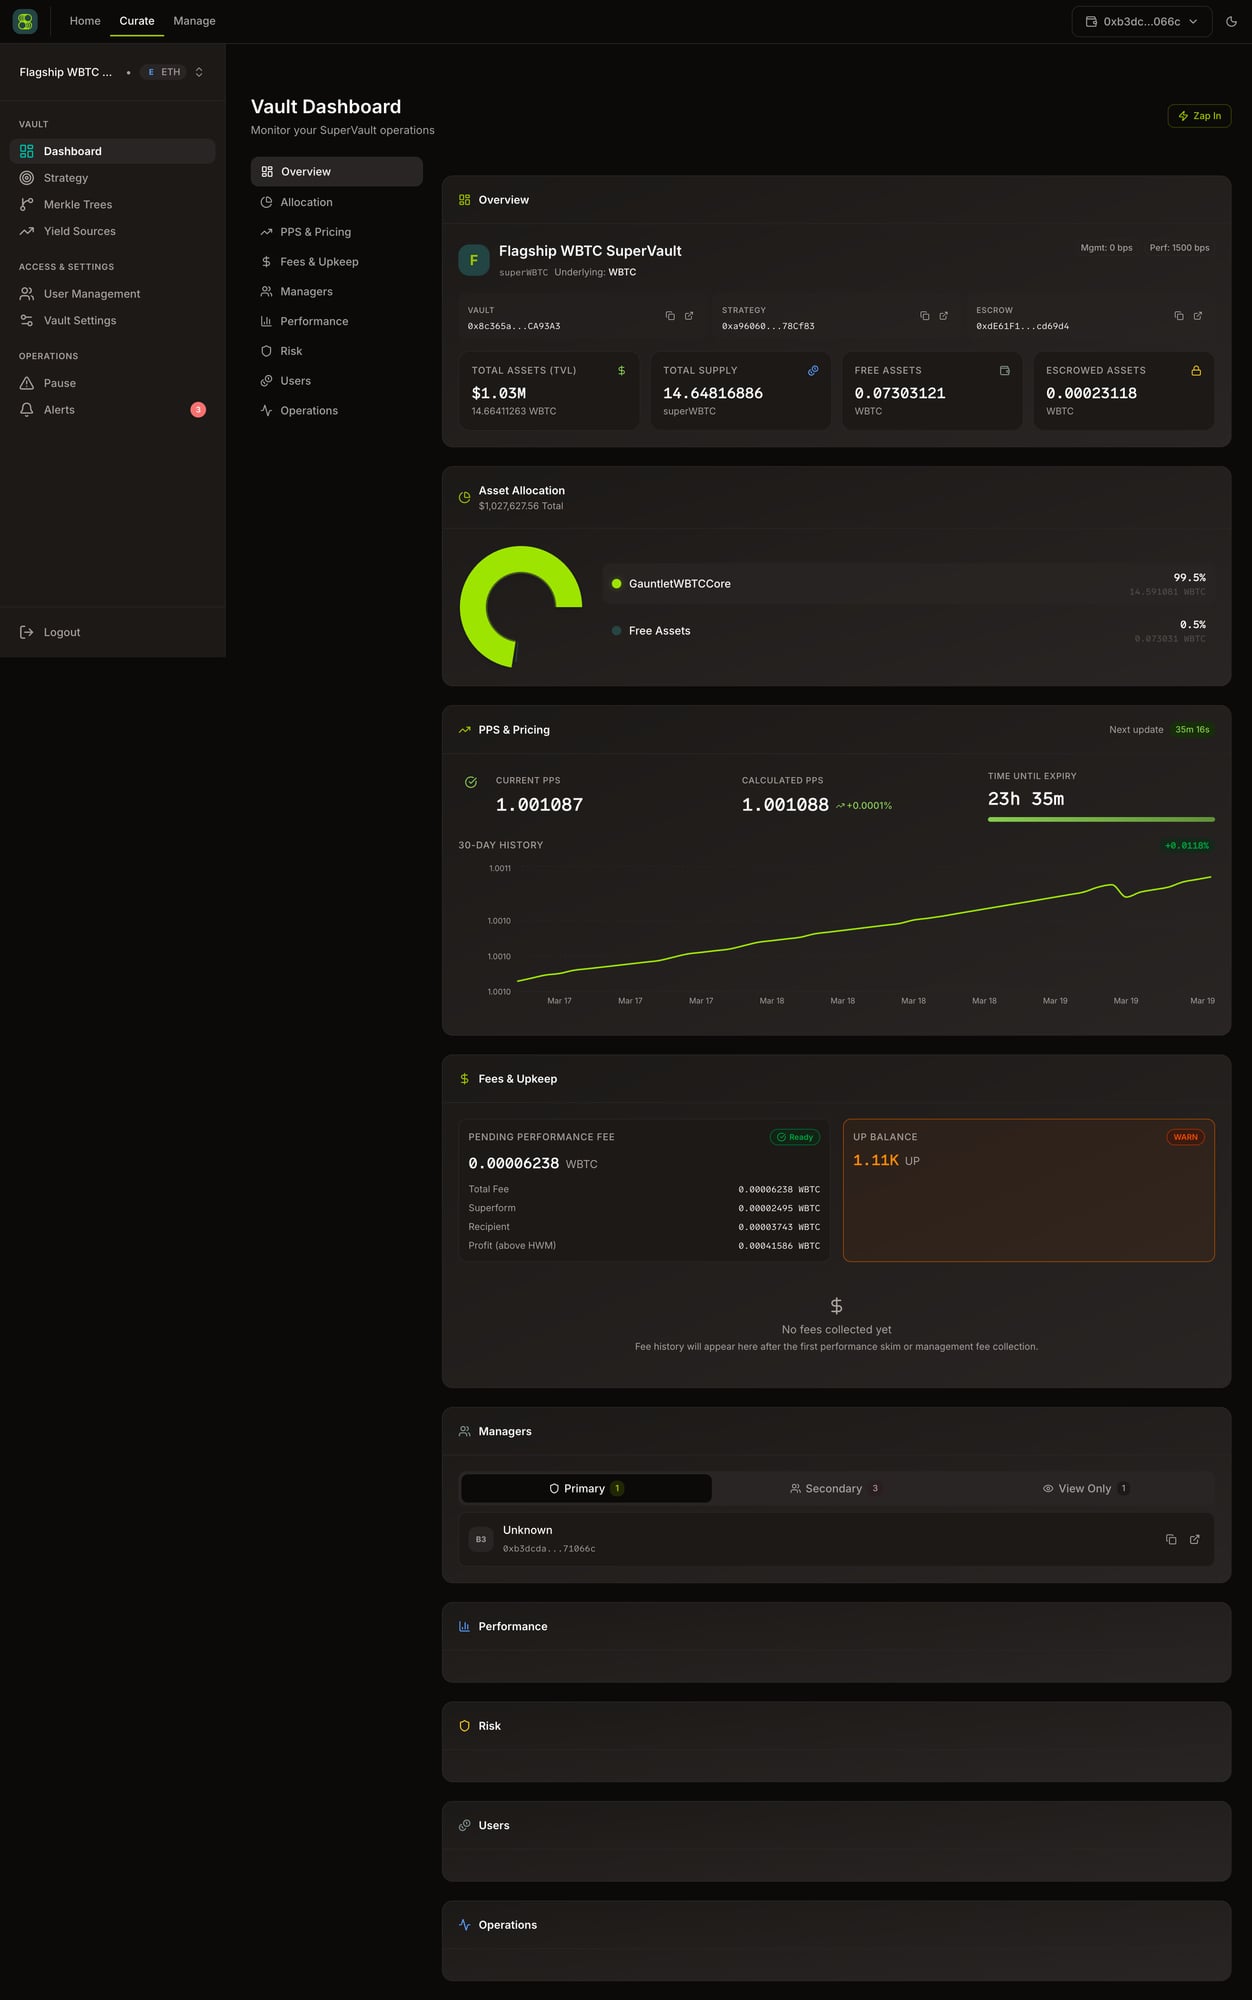
GET /api/v1/vaults/{chain_id}/{vault_address} plus Erebor analytics sub-endpoints.
1. Overview
Top-level vault health metrics:2. Allocation
Pie chart showing current distribution of vault assets across yield sources. Each slice represents one whitelisted yield source with its allocation amount and percentage of total.3. PPS & Pricing
PPS history chart (time series fromanalytics/pps). Current, calculated, and HWM values displayed alongside staleness countdown with visual indicator. Min/max update intervals from SuperGovernor config.
4. Fees & Upkeep
Fee configuration data comes from the vault detail endpoint (
GET /api/v1/vaults/{chain_id}/{address}) in the fee_config field. Fee history is derived from vault analytics and audit log data.
5. Managers
Lists all wallet addresses with roles on this vault: primary manager, secondary managers, view-only users.6. Performance
- APY overview: current, 7-day, 30-day from
analytics/overview - APY time series chart with selectable periods
- TVL time series chart with selectable periods
- 24h and 7d TVL change
7. Risk
Risk data has a 2-minute stale time.
8. Users
Fromanalytics/users: total users, active users (24h/7d/30d), new users (24h/7d/30d), churned users, retention rate (7d/30d), average deposit size. Includes retention cohort table and top holders table.
9. Operations
Fromanalytics/operations: transaction count, deposit and withdrawal counts, gas costs (average and total), slippage (average and max), net flow. Deposit/withdraw volume chart and transaction history table.
Zap Terminal
The Zap Terminal opens as a modal overlay providing AI-powered vault analysis: a narrative covering performance, risk, yield sources, fees, and liquidity. Also includes an operator-focused social feed and WebSocket-based AI chat for vault Q&A.The Zap Terminal analysis endpoint (
GET /api/v1/vaults/{vaultAddress}/ai/analysis?chain_id={}) is operational and used by the Zap Terminal.